Chemometrics & spectroscopy
Explore variation in your spectra, separate overlapping contributions and resolve energy-dependent distributions.

DataChem / Scientific data analysis
DataChem combines scientific expertise with Python tools tailored to your experimental data.
Experimental dataAnalysisModelScientific insight
Illustrative analysis · not experimental results
Explore variation in your spectra, separate overlapping contributions and resolve energy-dependent distributions.
Fit experimental curves and estimate parameters with explicit model assumptions.
Develop or adapt Python tools to your data to run processing steps, visualise results and reproduce analyses.
The figures show the analysis. Each study explains what it can reveal and its limitations.
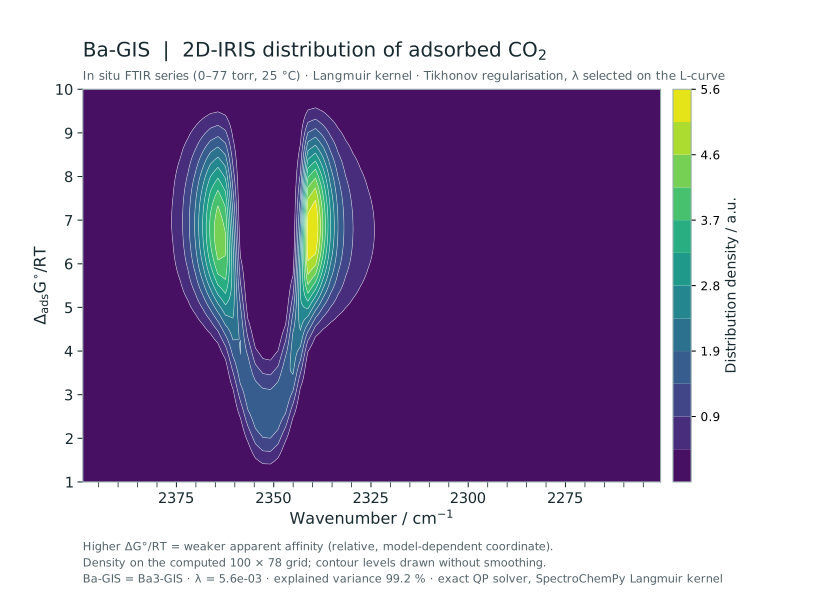
01 / Spectroscopy & adsorption
Combining FTIR analysis, PCA and MCR-ALS with equilibrium isotherm modelling to examine how CO₂ adsorption differs across zeolite samples.
Explore the study →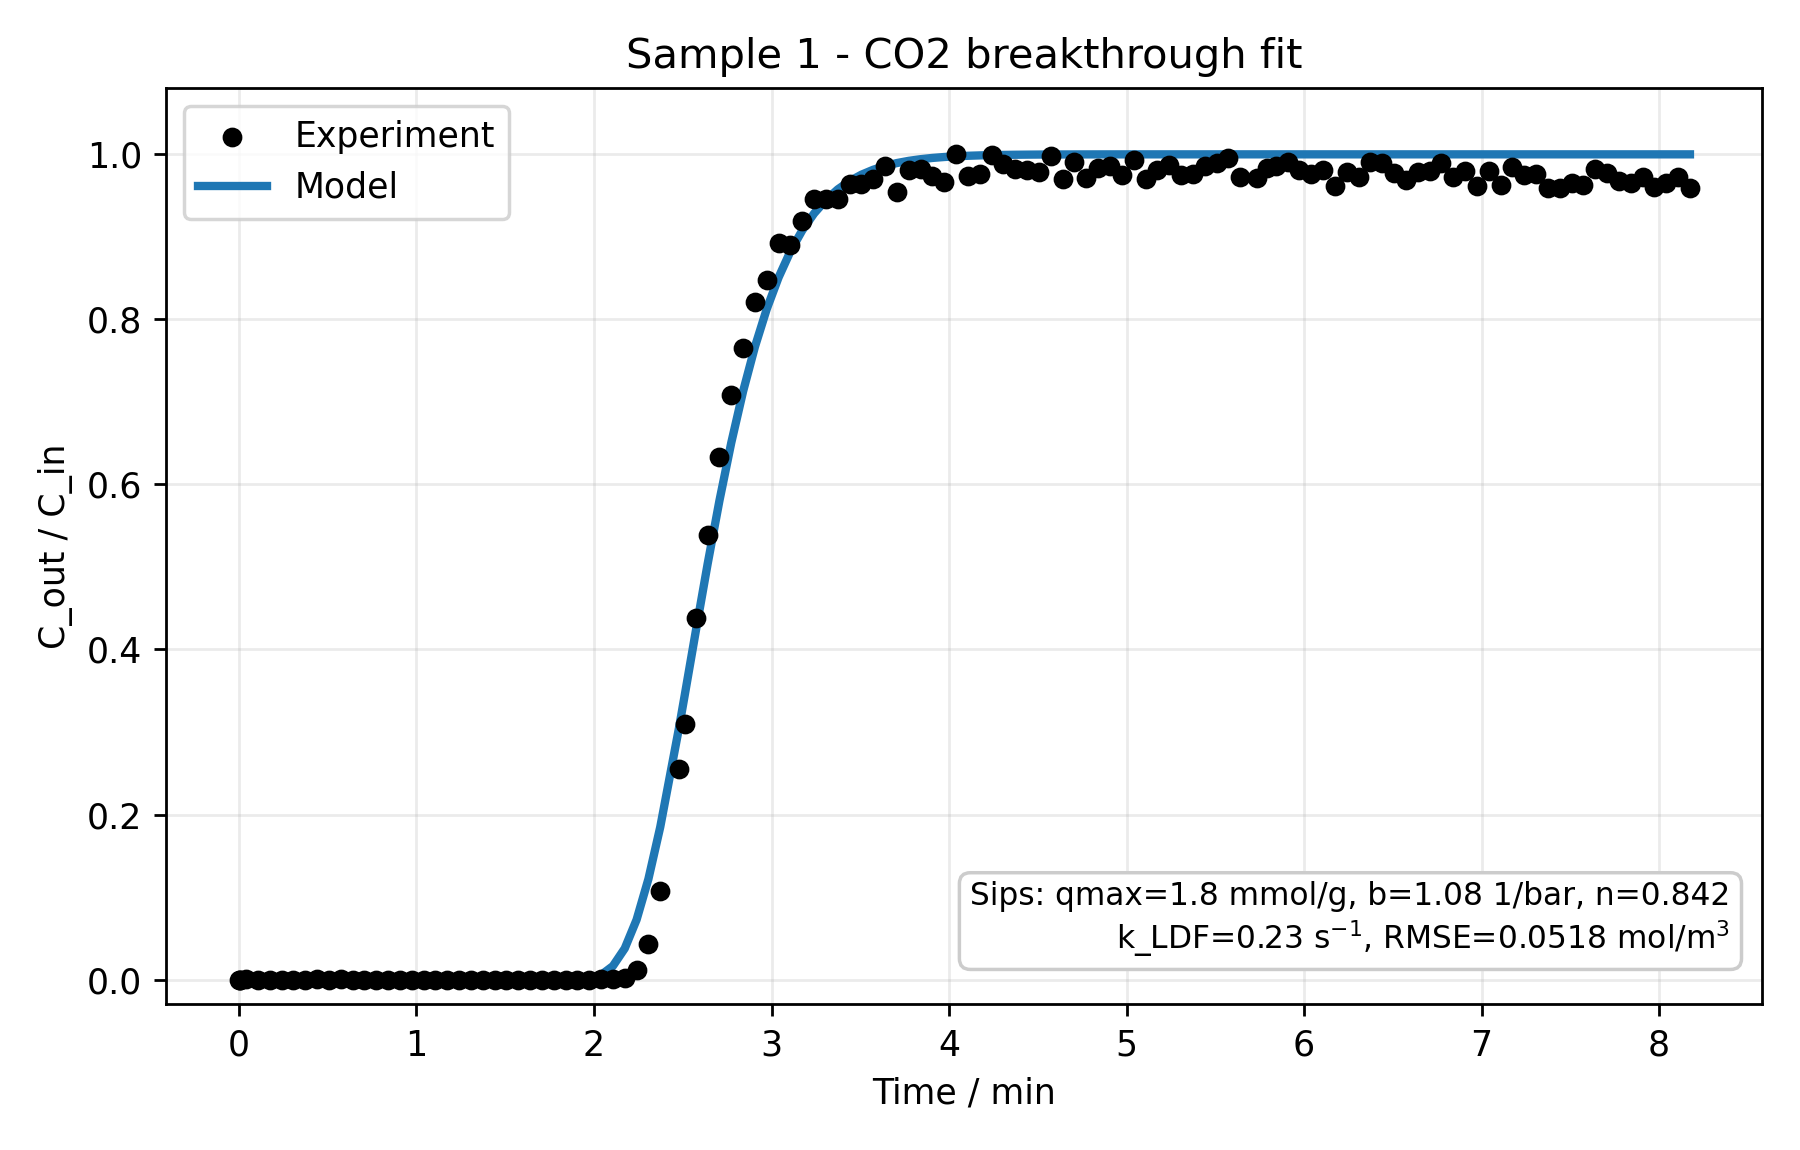
02 / Dynamic adsorption · Python tool
A DataChem tool developed in Python to process experimental data, fit models and extract the associated parameters.
Data → Model → Parameters → Report
Explore the tool and study →Clarify the objective, available data and expected output.
Check units, experimental conditions, quality and preprocessing.
Choose a suitable method, inspect residuals and discuss limitations.
Provide figures, indicators and a summary your team can use.

Your contact
PhD in chemistry, specialising in adsorption, spectroscopy and experimental-data analysis. An approach connecting numerical analysis with the measurements behind it.
Contact
Describe your question briefly, without including confidential data in this first enquiry.
The form sends your message directly to DataChem. You will receive a reply by email.