Compare
Compare breakthrough times across experiments under stated conditions.

Dynamic adsorption · DataChem Python tool
A scientific tool developed by DataChem to process your measurements, fit an adsorption model and produce results to interpret with your team.
Developed in Python, this tool runs the steps of breakthrough analysis using a configuration defined for the experiment. It is used within a service and can be adapted to a laboratory or R&D team’s needs.
Data → Model → Parameters → Report
Calculations run after configuration. Units, assumptions, fixed or fitted parameters and convergence checks remain subject to scientific review. A generated report must be reviewed before delivery.
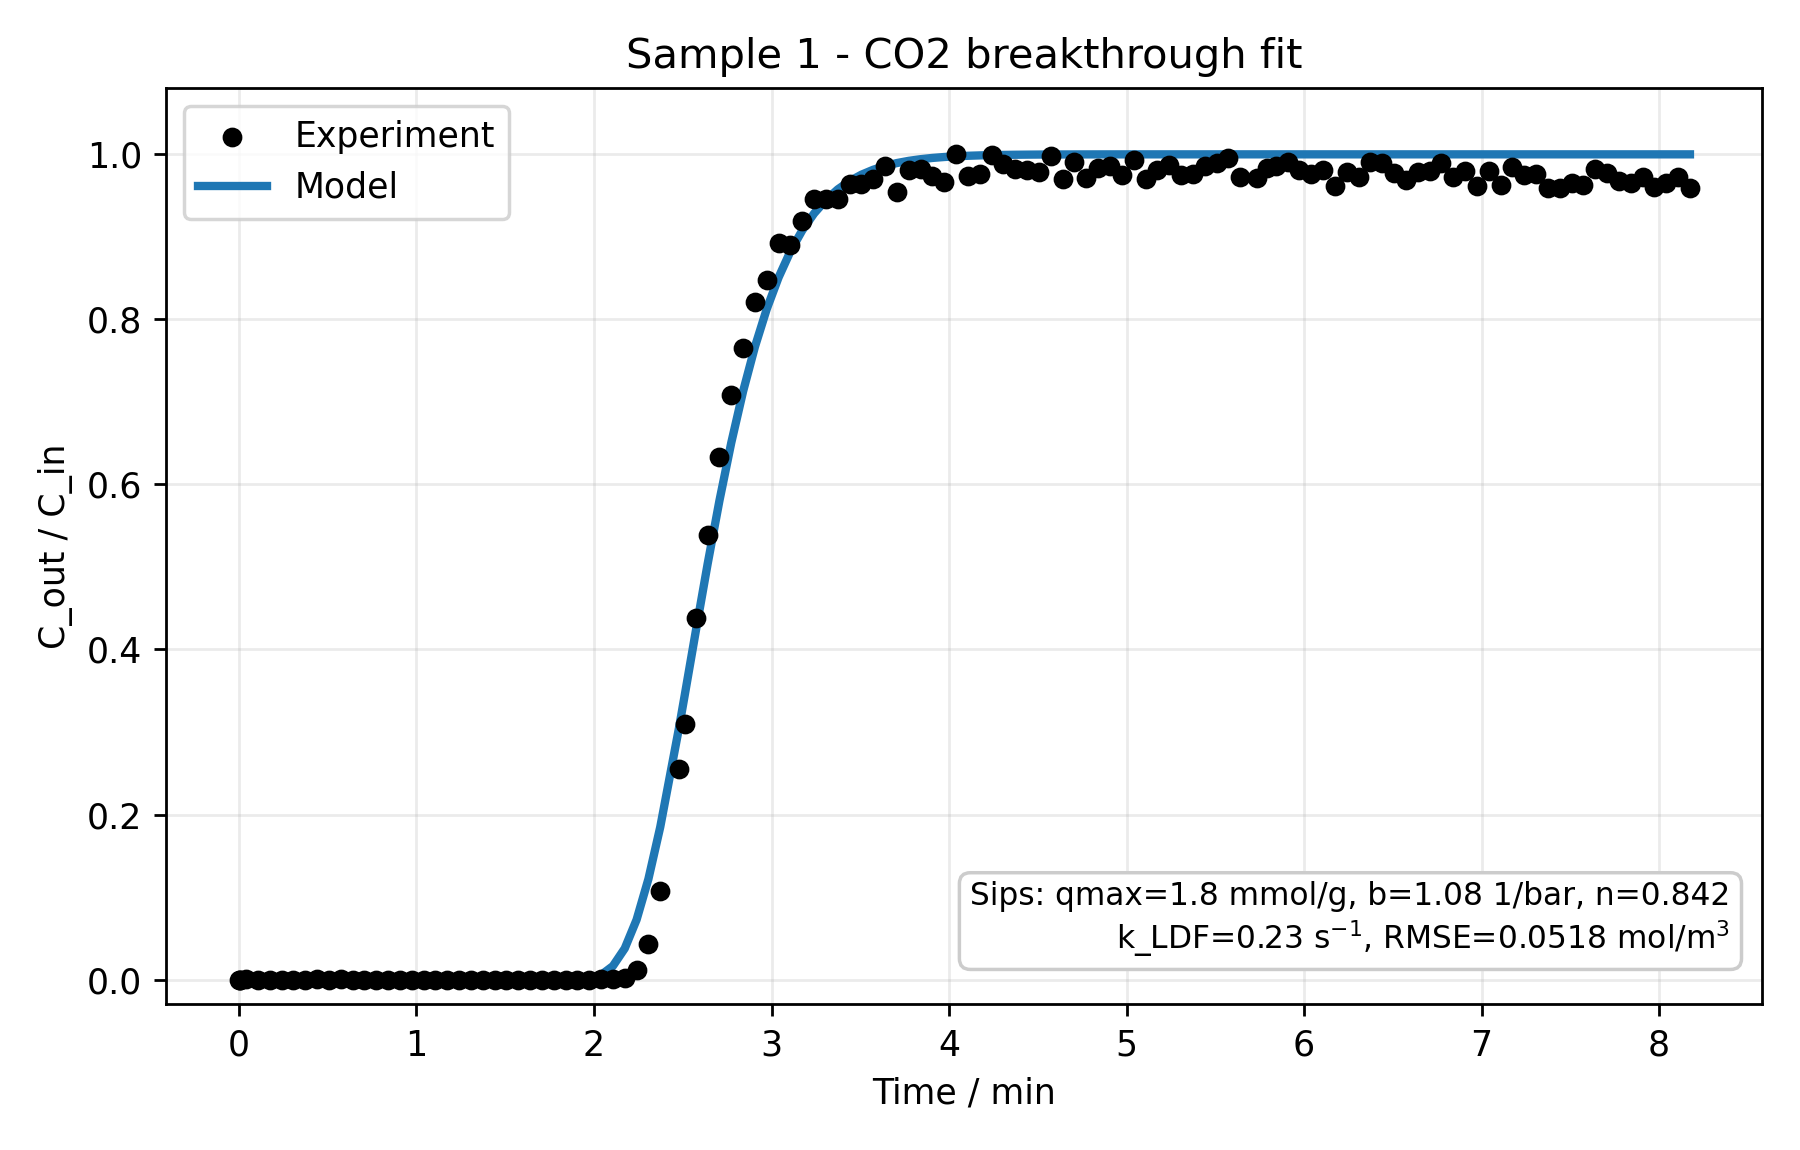
The figure shows a Sips-LDF fit to a CO₂ breakthrough curve. Points represent measurements and the line is the fitted model response.
| Indicator | Measurement | Model |
|---|---|---|
| Breakthrough at 5% of C/C₀ | 2.31 min | 2.20 min |
| Breakthrough at 50% | 2.61 min | 2.64 min |
| Breakthrough at 95% | 3.39 min | 3.33 min |
| kLDF | — | 0.230 s⁻¹ |
| RMSE | — | 0.0518 mol/m³ |
Rounded values from the summary corresponding to the figure. RMSE is expressed in concentration units, while the figure displays C/C₀.
The model describes the main transition. A discrepancy remains at the plateau. The 5% threshold is predicted about 7 seconds before the measurement; this difference matters for interpretation.
kLDF is an effective parameter estimated within this model. It does not by itself separate all mass-transfer resistances. The fit includes a time shift of about 94 seconds, which must be examined alongside measurement delays and apparatus volumes.
This comparison is a fit to the analysed data, not independent validation. Prediction at another flow rate, temperature or composition requires additional checks.
Compare breakthrough times across experiments under stated conditions.
Examine curve shapes, model discrepancies and parameter sensitivity.
Select additional experiments to test transport hypotheses.