Chemometrics & spectroscopy
Explore variation in your spectra, separate overlapping contributions and resolve energy-dependent distributions.

Expertise & applications
The method depends on your measurements and the evidence required. An initial discussion helps define a realistic scope.
Explore variation in your spectra, separate overlapping contributions and resolve energy-dependent distributions.
Fit experimental curves and estimate parameters with explicit model assumptions.
Develop or adapt Python tools to your data to run processing steps, visualise results and reproduce analyses.
From GC data to catalytic performance
DataChem develops and adapts scientific Python workflows to process experimental GC data and calculate catalytic performance indicators. Processing, visualisation and reporting are tailored to your experimental conditions, with explicit assumptions and traceable calculations.
GC data processing
Configurable quality checks
Conversion · Selectivity · Yield
Performance over time · Experimental-condition comparison
Figures · Tables · Excel reports
Traceable calculations
Explore parameter distributions from spectroscopic, adsorption or diffusion measurements. Interpretation depends on the inversion model and data quality.
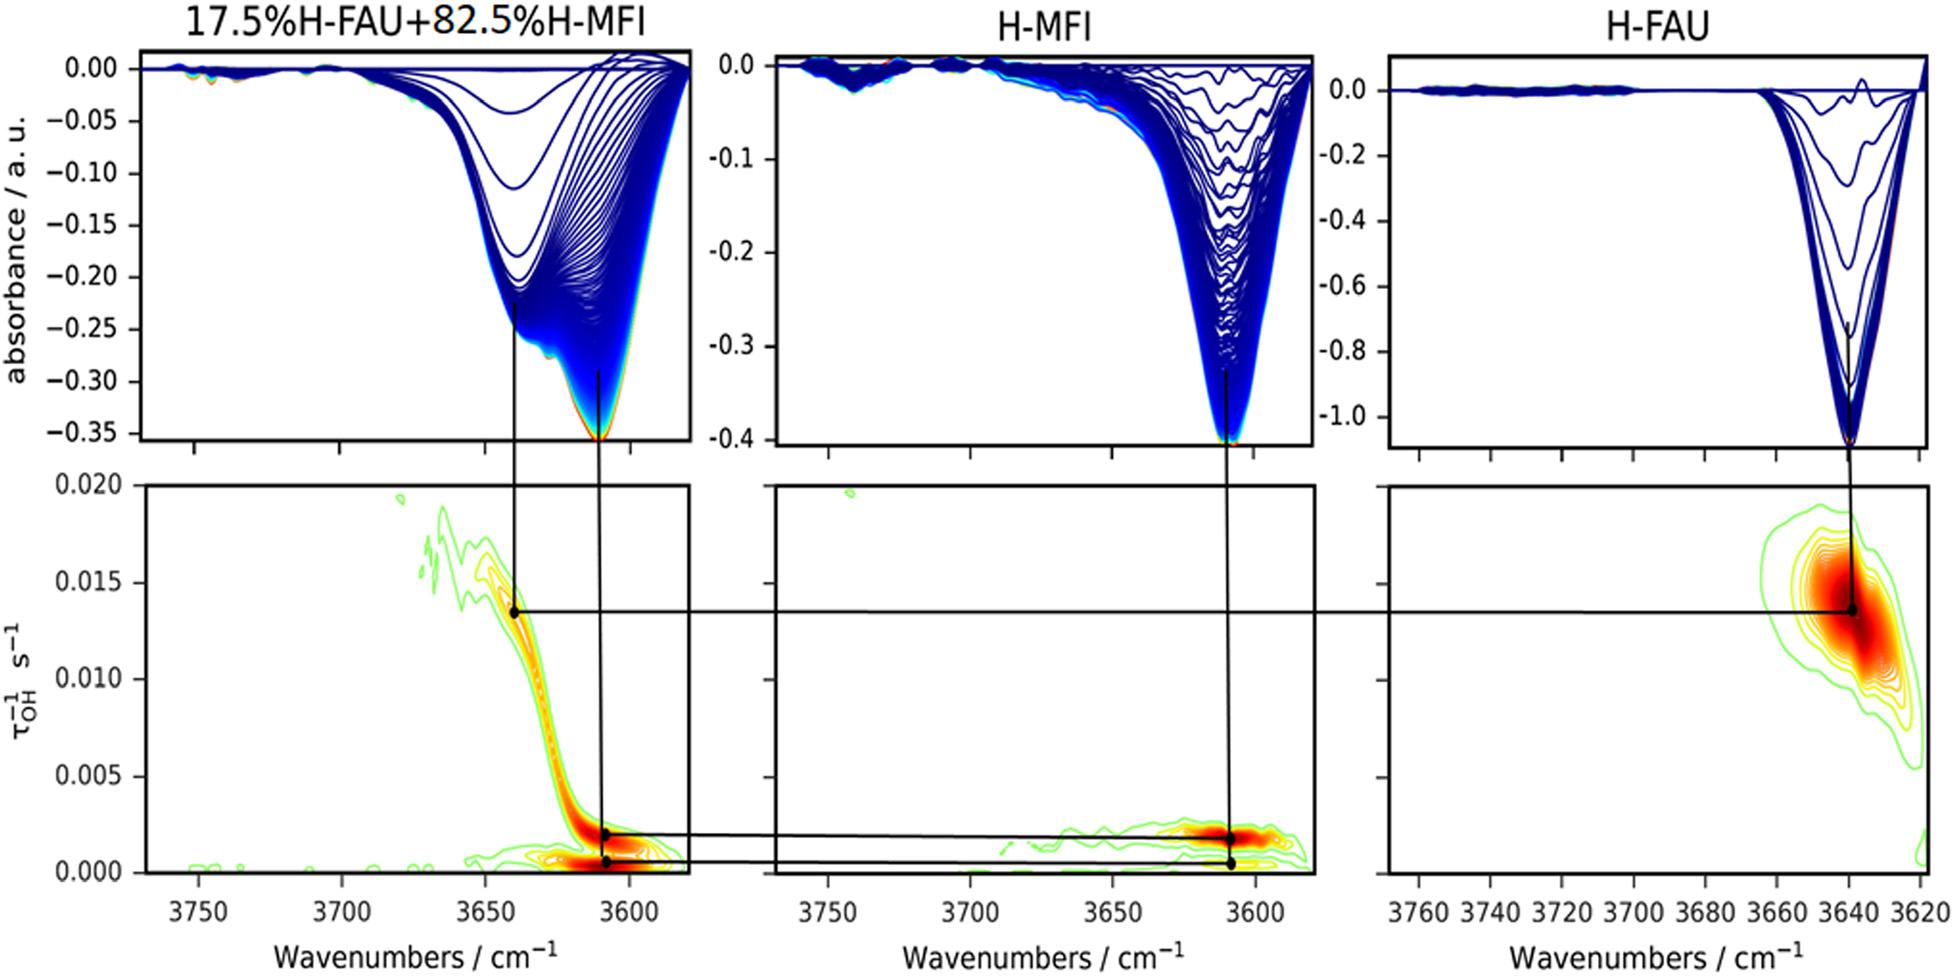
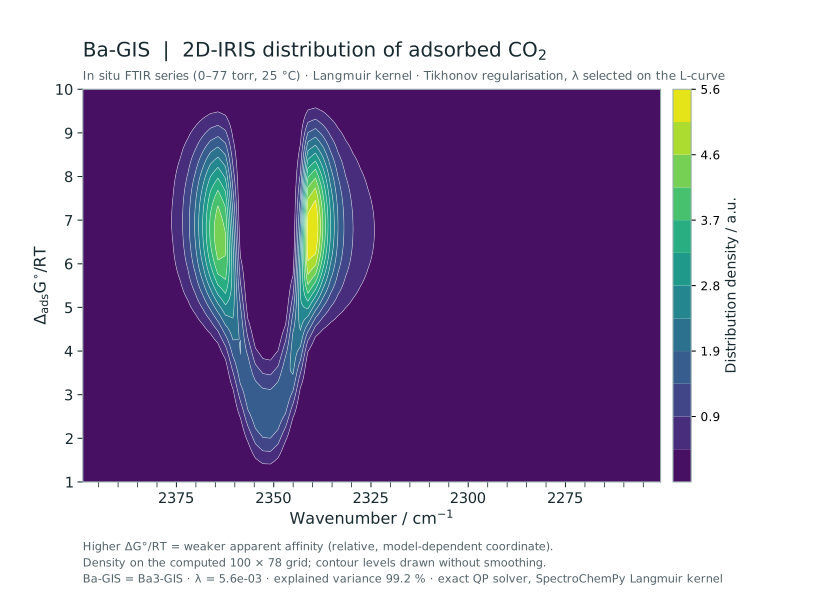
Explore the 2D-IRIS methodology →
Collaborative research: Ba-exchanged gismondine for CO₂ direct air capture (DAC), J. Mater. Chem. A, 2026. Data analysis: Abdelhafid Ait Blal. These figures do not represent a DataChem client assignment.