
01 / From data to insight
One sample. Multiple analytical perspectives.
Using Ba-GIS as a case study, we combine complementary analyses of in situ FTIR and equilibrium adsorption measurements to examine CO₂ adsorption behaviour.
Ba-GIS refers to the Ba3-GIS dataset in the original collaborative research.
The analytical approach
One system. Complementary evidence.
Ba-GIS Experimental system
One material. Two complementary measurement families.
Branch A
In situ FTIR data
Examine how spectral signals evolve across the experimental series.
- PCA
Assess data dimensionality and dominant variance.
- MCR-ALS
Resolve overlapping spectral contributions and examine their relative evolution.
- 2D-IRIS
Explore adsorption heterogeneity through an energy-resolved spectroscopic perspective, within the assumptions of the inversion model.
PCA can inform the number of components tested with MCR-ALS.
Branch B
CO₂ equilibrium adsorption data
Examine adsorption uptake as a function of equilibrium pressure.
- Isotherm modelling
Describe adsorption behaviour and assess model parameters.
Independent experimental evidence
Equilibrium measurements are fitted separately. Neither MCR-ALS nor 2D-IRIS outputs serve as input to these fits.
Scientific interpretation
Integrate complementary evidence from spectroscopy and equilibrium adsorption to build a more complete picture of CO₂ adsorption behaviour, while preserving the limits of each method.
Complementary evidence does not imply a one-to-one correspondence between spectral contributions and adsorption sites.
02 / FTIR measurements
Start with the experimental signal.
The Ba-GIS spectral series records changes during successive CO₂ additions. These measurements provide the common experimental basis for the spectroscopic analyses.

What the data provide
A measured series in which overlapping bands change across the experiment.
These are exported spectral data. The complete historical preprocessing from the raw acquisitions is not reconstructed here.
03 / PCA
How compactly can the variation be described?
PCA assesses the dominant variation in the FTIR matrix. It can guide the component counts tested during MCR-ALS analysis.
- PC1
- 91.878%
- PC2
- 7.409%
- PC1 + PC2
- 99.287%
Explained variance for Ba3-GIS, rounded to three decimals. The archive values are reproduced by column-centred PCA of the available spectral matrix.

Two dominant components do not establish two chemical species or two adsorption sites.
04 / MCR-ALS
Separate overlapping spectral contributions.
The archived non-negative MCR-ALS solution contains two spectral contributions. Their profiles and relative evolution offer complementary views of the same spectral dataset.

What resolution adds
Distinct spectral signatures that overlap in the original measurements become easier to examine.
The relative contributions evolve differently across the series. Their amplitudes are not calibrated concentrations or percentages of site populations.
Relative evolution and reconstruction limits

The figures can be traced from the archived factors without rerunning MCR-ALS. The complete historical initialisation, convergence settings and normalisation are not available. Chemical assignment requires additional evidence.
05 / 2D-IRIS
A complementary view of adsorption heterogeneity.
Explore adsorption heterogeneity through an energy-resolved spectroscopic perspective, within the assumptions of the inversion model.
A separate spectroscopic analysis
2D-IRIS examines the FTIR data through an inversion model. It is not presented as an output of MCR-ALS.
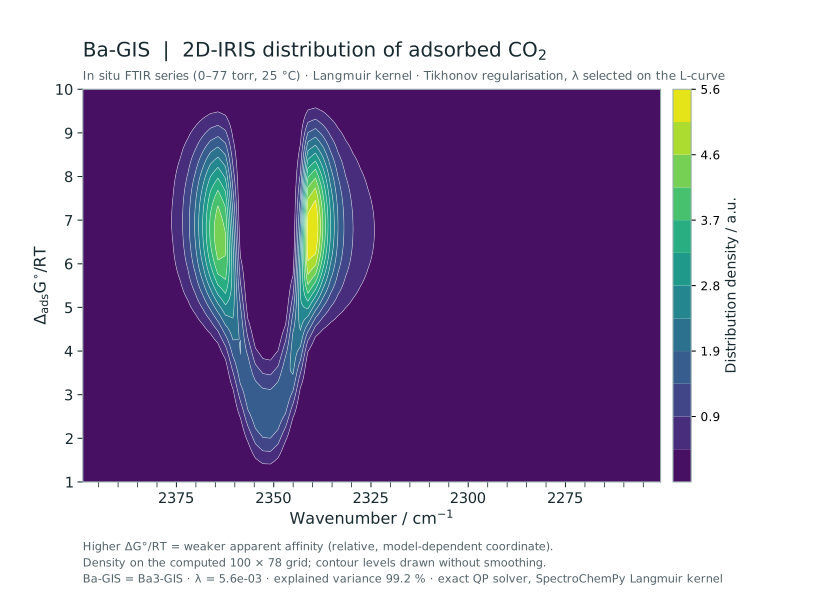
The recomputed distribution shows two main regions near 2364 and 2339 cm⁻¹ at a weak apparent affinity, joined by a narrower feature near 2350 cm⁻¹ extending towards stronger apparent affinity. Their positions along the vertical axis are relative to the Langmuir model and to the regularisation.
How was this recomputed?
From the same 24 exported difference spectra (0–77 torr, 25 °C), with SpectroChemPy’s Langmuir kernel, an exact quadratic-programming solver and a regularisation parameter selected on the L-curve. Reconstruction explains 99.2 % of the variance. No historical image was digitised.
06 / Independent equilibrium adsorption
Confront the measurements with a model.
Ba-GIS equilibrium isotherms at 0, 25 and 50 °C were fitted independently using Langmuir–Freundlich models in OriginPro, reported in the manuscript (Figure 2b) and its supporting information (Figure S8).
This branch is presented here as a methodological account of the published fit and its documented limits, not as a redrawn figure: the underlying isotherm points and native fitting project are not available to us, and no figure is digitised or approximated from the manuscript.
Reading the fit
A good fit is not enough.
Assess parameter uncertainty and physical interpretability alongside fit quality.
Limits of the archived Ba-GIS fits
The Ba3-GIS fit at 25 °C includes poorly constrained parameters. At 50 °C, the two fitted terms are identical. A close fit therefore does not establish two distinct adsorption-site populations. The underlying points and fitting settings are needed before reproducing or extending these fits.
07 / Scientific interpretation
Bring the analytical perspectives together.
Integrate complementary evidence from spectroscopy and equilibrium adsorption to build a more complete picture of CO₂ adsorption behaviour, while preserving the limits of each method.
What becomes actionable
Identify the dominant spectral variation, examine resolved contributions and discuss adsorption behaviour alongside the assumptions of each analysis.
What remains a hypothesis
Unique chemical assignments, site populations and predictions outside the measured conditions require further evidence.
Complementary evidence does not imply a one-to-one correspondence between spectral contributions and adsorption sites.
Research context
A traceable methodological demonstration.
This is collaborative research, not a DataChem client project. Ba-GIS is the public-facing name for the Ba3-GIS dataset; the scientific source files retain their original names.
Tools, provenance and scope
Python and SpectroChemPy are documented for the chemometric analyses; equilibrium isotherm fitting was performed separately in OriginPro. The complete historical code and an automated end-to-end reporting pipeline are not available in the archive.
Abdelhafid Ait Blal is credited in the research submission for methodology, software and formal analysis. The final credit wording remains to be confirmed. Permission for the four FTIR/PCA/MCR visualizations and the recomputed 2D-IRIS distribution has been confirmed by the DataChem owner; the equilibrium-isotherm figure is not reproduced here, since the underlying isotherm points and native fitting project are not available to us.